# Enable and understand application status

This topic describes how to configure your application so that you can view the status of application instances in the Replicated Vendor Portal. It also describes the meaning of the different application statuses.

## Overview

The Vendor Portal displays data on the status of instances of your application that are running in customer environments, including the current state (such as Ready or Degraded), the instance uptime, and the average amount of time it takes your application to reach a Ready state during installation. For more information about viewing instance data, see [Instance Details](instance-insights-details).

To compute and display these insights, the Vendor Portal interprets and aggregates the state of one or more of the supported Kubernetes resources that are deployed to the cluster as part of your application.

The following resource types are supported:

* Deployment
* StatefulSet
* Service
* Ingress
* PersistentVolumeClaims (PVC)
* DaemonSet

For more information about how instance data is sent to the Vendor Portal, see [About Instance and Event Data](instance-insights-event-data).

## Enable application status insights

To display insights on application status, the Vendor Portal requires that your application has one or more _status informers_. Status informers indicate the Kubernetes resources deployed as part of your application that are monitored for changes in state.

For information about how to enable status informers, see the sections below:
* [Helm CLI Installations](#helm-cli-installations)
* [Replicated Installers](#replicated-installers)

### Helm CLI installations

For Helm CLI installations, you can include the Replicated SDK as a dependency in your primary Helm chart to get status data. When the application is deployed using `helm install` or `helm upgrade`, the SDK automatically detects and reports the status of resources in the Helm release for the given chart. You can also override the list of resources that get reported on using the SDK's [`statusInformers`](https://github.com/replicatedhq/replicated-sdk/blob/main/chart/values.yaml#L287) value.

To get instance status data for installations with the Helm CLI:

1. In your application Helm chart `Chart.yaml` file, add the YAML below to declare the SDK as a dependency. If your application is installed as multiple charts, declare the SDK as a dependency of the chart that customers install first. Do not declare the SDK in more than one chart. For more information, see [Install the Replicated SDK](/vendor/replicated-sdk-installing).

   ```yaml
   # Chart.yaml
   dependencies:
   - name: replicated
     repository: oci://registry.replicated.com/library
     version: 1.18.2
   ```

   For the latest version information for the Replicated SDK, see the [replicated-sdk repository](https://github.com/replicatedhq/replicated-sdk/releases) in GitHub.

1. If either of the following are true, list all the resources that you want the SDK to report on in the SDK's [`statusInformers`](https://github.com/replicatedhq/replicated-sdk/blob/main/chart/values.yaml#L287) field:

     * You want the SDK to report on resources outside the Helm release for the chart where it is included as a dependency. For example, your application is installed as multiple charts and you want status data for resources created by subcharts.
     * Your application is installed by running `helm template` then `kubectl apply`, rather than `helm install` or `helm upgrade`. In this case, the SDK is unable to automatically detect resources in the Helm release.

     **Example:**

     ```yaml
     # Your Helm chart values.yaml file 

     replicated:
       # list all resources that you want the SDK to report on
       statusInformers:
         - deployment/nginx
         - statefulset/mysql
     ```

     :::note
     When `statusInformers` is set, the SDK reports the status of only the resources included in the `statusInformers` field.
     :::

### Replicated installers

To get instance insights from installations with a Replicated installer (Embedded Cluster, existing cluster KOTS, kURL), configure one or more status informers in the KOTS Application custom resource. For more information, see [Adding Resource Status Informers](admin-console-display-app-status).

:::note
When Helm-based applications that include the Replicated SDK and are deployed by a Replicated installer, the SDK inherits the status informers configured in the KOTS Application custom resource. In this case, the SDK does _not_ automatically report the status of the resources that are part of the Helm release. This prevents discrepancies in the instance data in the vendor platform.
:::

## View resource status insights {#resource-status}

For applications that include the Replicated SDK, the Vendor Portal also displays granular resource status insights in addition to the aggregate application status. For example, you can hover over the **App status** field on the **Instance details** page to view the statuses of the individual resources deployed by the application, as shown below:

<img src="/images/resource-status-hover-current-state.png" alt="resource status pop up" width="400px"/>

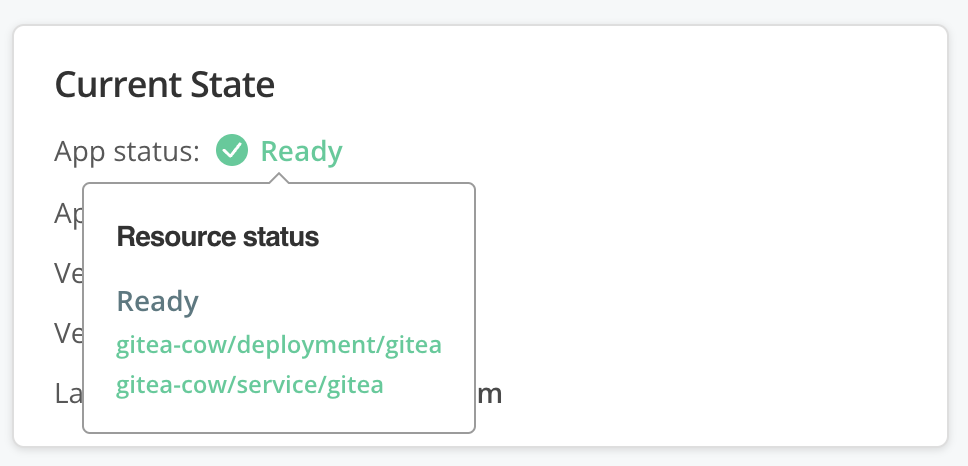
[View a larger version of this image](/images/resource-status-hover-current-state.png)

Viewing these resource status details is helpful for understanding which resources are contributing to the aggregate application status. For example, when an application has an Unavailable status, that means that one or more resources are Unavailable. By viewing the resource status insights on the **Instance details** page, you can quickly understand which resource or resources are Unavailable for the purpose of troubleshooting.

Granular resource status details are automatically available when the Replicated SDK is installed alongside the application. For information about how to distribute and install the SDK with your application, see [Install the Replicated SDK](/vendor/replicated-sdk-installing).

## Understanding application status

This section provides information about how Replicated interprets and aggregates the status of Kubernetes resources for your application to report an application status.

### About resource statuses {#resource-statuses}

Possible resource statuses are Ready, Updating, Degraded, Unavailable, and Missing.

The following table lists the supported Kubernetes resources and the conditions that contribute to each status:

<table>
 <tbody>
    <tr>
      <th width="10%"></th>
      <th width="15%">Deployment</th>
      <th width="15%">StatefulSet</th>
      <th width="15%">Service</th>
      <th width="15%">Ingress</th>
      <th width="15%">PVC</th>
      <th width="15%">DaemonSet</th>
    </tr>
    <tr>
    <th>Ready</th>
      <td>Ready replicas equals desired replicas</td>
      <td>Ready replicas equals desired replicas</td>
      <td>All desired endpoints are ready, any load balancers have been assigned</td>
      <td>All desired backend service endpoints are ready, any load balancers have been assigned</td>
      <td>Claim is bound</td>
      <td>Ready daemon pods equals desired scheduled daemon pods</td>
    </tr>
    <tr>
    <th>Updating</th>
      <td>The deployed replicas are from a different revision</td>
      <td>The deployed replicas are from a different revision</td>
      <td>N/A</td>
      <td>N/A</td>
      <td>N/A</td>
      <td>The deployed daemon pods are from a different revision</td>
    </tr>
    <tr>
      <th>Degraded</th>
      <td>At least 1 replica is ready, but more are desired</td>
      <td>At least 1 replica is ready, but more are desired</td>
      <td>At least one endpoint is ready, but more are desired</td>
      <td>At least one backend service endpoint is ready, but more are desired</td>
      <td>N/A</td>
      <td>At least one daemon pod is ready, but more are desired</td>
    </tr>
    <tr>
      <th>Unavailable</th>
      <td>No replicas are ready</td>
      <td>No replicas are ready</td>
      <td>No endpoints are ready, no load balancer has been assigned</td>
      <td>No backend service endpoints are ready, no load balancer has been assigned</td>
      <td>Claim is pending or lost</td>
      <td>No daemon pods are ready</td>
    </tr>
    <tr>
      <th>Missing</th>
      <td colSpan="6">Missing is an initial deployment status indicating that informers have not reported their status because the application has just been deployed and the underlying resource has not been created yet. After the resource is created, the status changes. However, if a resource changes from another status to Missing, then the resource was either deleted or the informers failed to report a status.</td>
    </tr>
  </tbody>
</table>

### Aggregate application status

When you provide more than one Kubernetes resource, Replicated aggregates all resource statuses to display a single application status.

Replicated uses the least available resource status to represent the aggregate application status. For example, if at least one resource has an Unavailable status, then the aggregate application status is Unavailable.

The following table describes the resource statuses that define each aggregate application status:

<table>
  <tbody>
    <tr>
      <th>Resource Statuses</th>
      <th>Aggregate Application Status</th>
    </tr>
    <tr>
     <td>No status available for any resource</td>
      <td>Missing</td>
    </tr>
    <tr>
      <td>One or more resources Unavailable</td>
      <td>Unavailable</td>
    </tr>
    <tr>
      <td>One or more resources Degraded</td>
      <td>Degraded</td>
    </tr>
    <tr>
      <td>One or more resources Updating</td>
      <td>Updating</td>
    </tr>
    <tr>
      <td>All resources Ready</td>
      <td>Ready</td>
    </tr>
  </tbody>
</table>